What drives Environment & Ecology cost in 2026?
Author
Date Published
Reading Time
Environment & Ecology cost in 2026 is no longer a narrow utilities issue. It now affects permitting speed, capital planning, insurance exposure, and long-term operating continuity across industrial environments.
The biggest shift is that Environment & Ecology cost increasingly reflects measurable risk. Compliance, treatment capacity, energy intensity, and traceable ESG data now influence both direct spending and strategic flexibility.
For complex facilities, the real question is not whether costs will rise. The better question is which scenarios create unavoidable cost pressure, and where optimization remains realistic without weakening resilience.
Why scenario judgment matters for Environment & Ecology cost in 2026
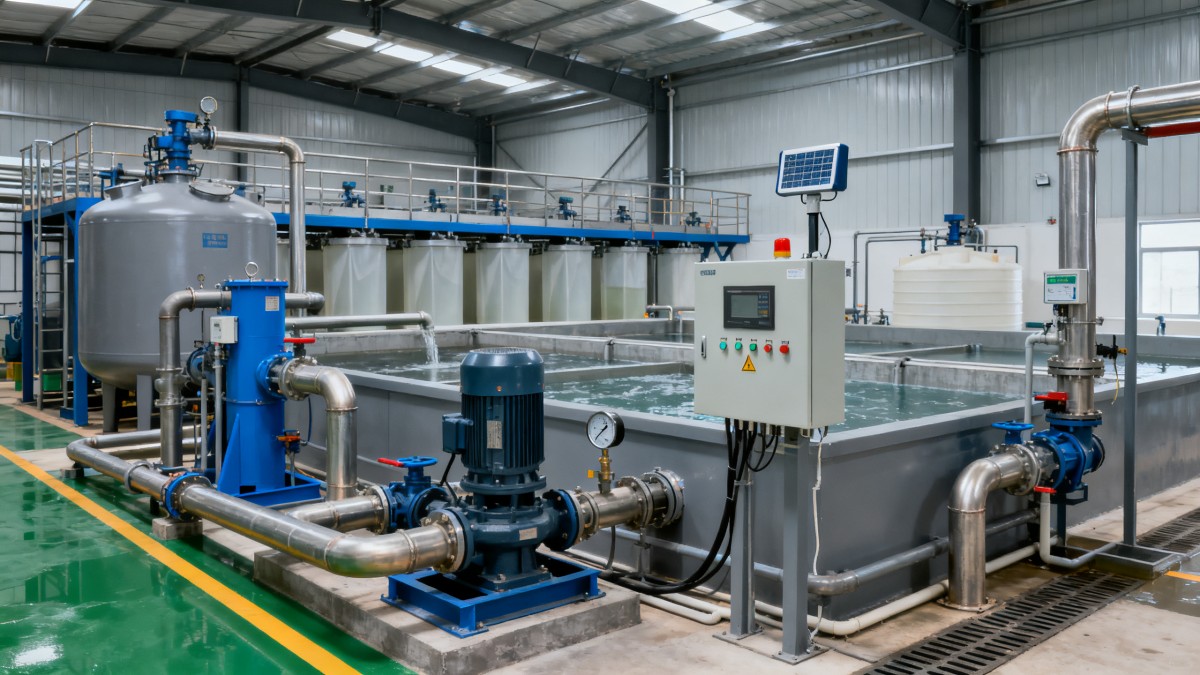
Environment & Ecology cost behaves differently across industries, sites, and regulatory regions. A power-intensive plant faces very different pressure than a water-stressed processing site or a hazardous waste generator.
This is why broad averages often mislead financial planning. Cost inflation may be driven by chemistry, discharge limits, transport distance, carbon reporting demands, or equipment reliability rather than labor alone.
In 2026, four forces shape most Environment & Ecology cost scenarios:
- Tighter environmental compliance and monitoring requirements
- Higher electricity, fuel, and treatment input prices
- Supply-chain volatility for chemicals, filters, membranes, and parts
- Stronger demand for auditable ESG and lifecycle performance data
Facilities that identify their dominant scenario early can forecast Environment & Ecology cost more accurately. They can also separate structural cost drivers from avoidable operational inefficiencies.
Scenario 1: High-compliance sites face structural Environment & Ecology cost growth
Sites operating under strict discharge, air emission, or waste handling rules often see the fastest increase in Environment & Ecology cost. Monitoring frequency alone can raise ongoing service and calibration budgets.
The deeper cost driver is not just regulation. It is the need for verified records, validated instruments, certified treatment performance, and faster response when readings approach thresholds.
Core judgment points
- Are local limits becoming stricter for effluent, VOCs, particulates, or sludge disposal?
- Does the site require continuous emissions or water quality monitoring?
- Are manual logs being replaced by digital audit trails?
- Do non-compliance penalties exceed preventive maintenance costs?
In this scenario, Environment & Ecology cost is mostly structural. Reductions usually come from system integration, predictive maintenance, and fewer reporting failures, not from cutting critical controls.
Scenario 2: Energy-intensive treatment systems amplify Environment & Ecology cost
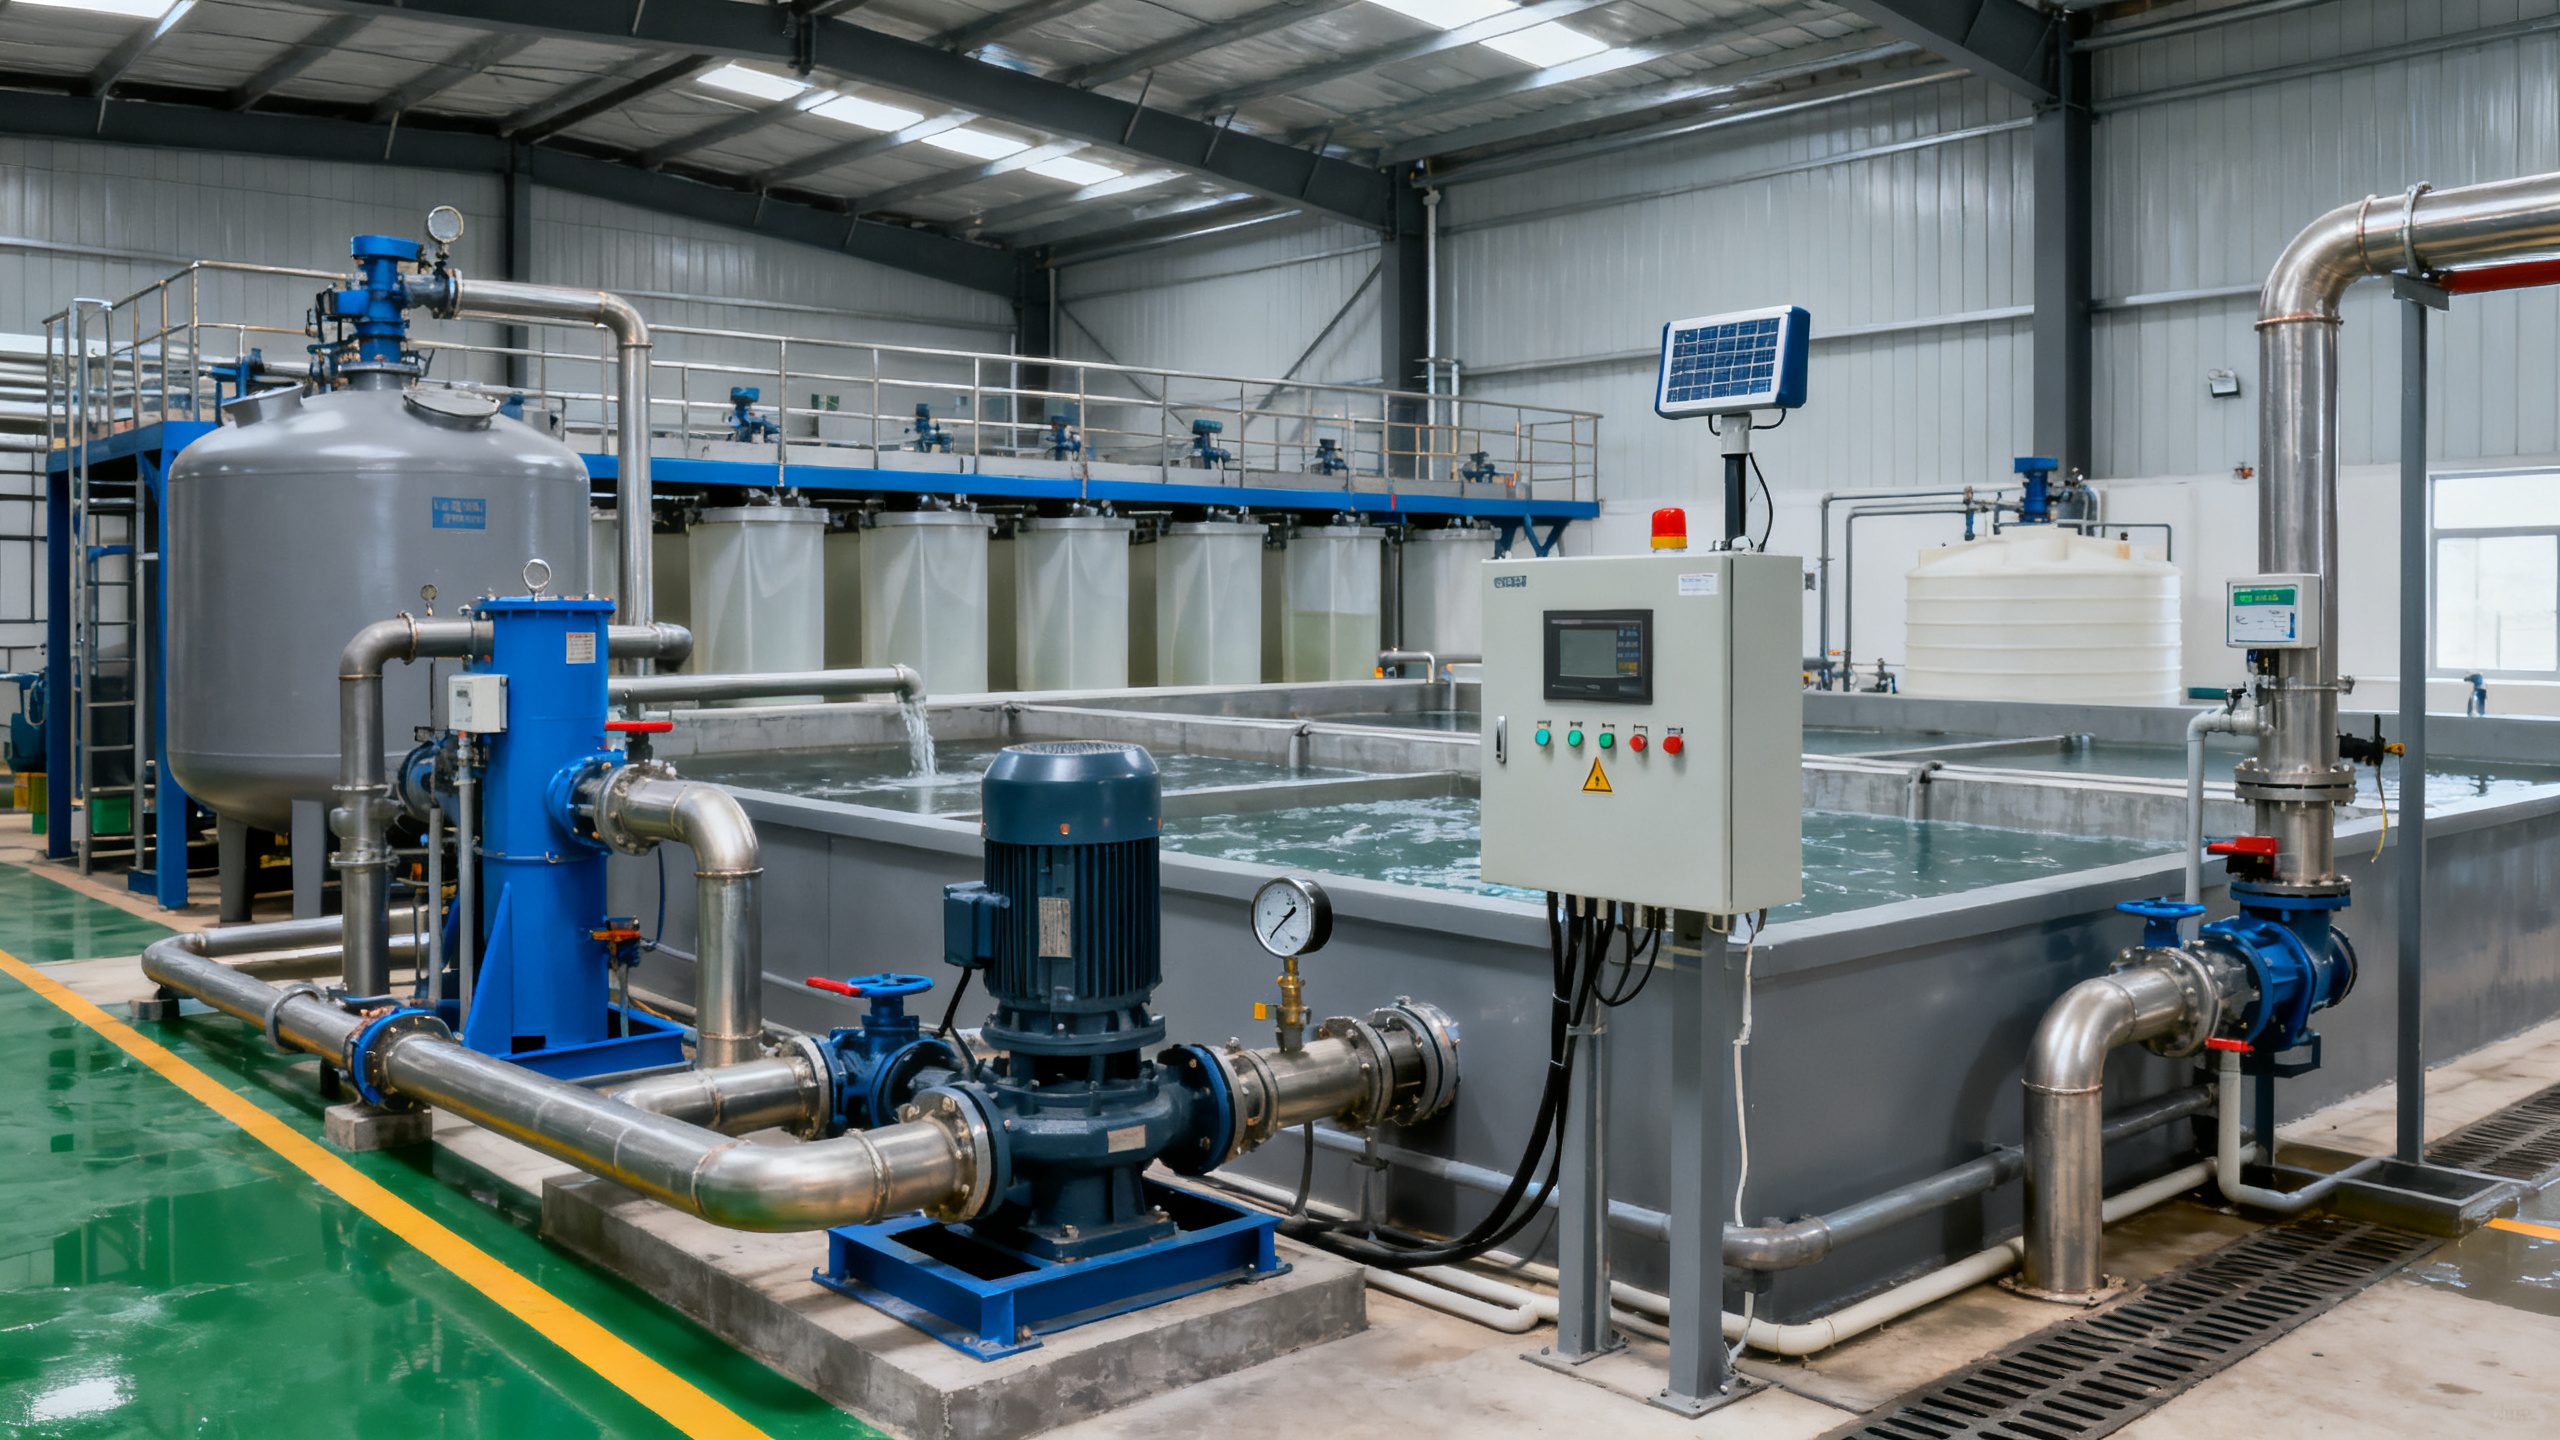
Some facilities carry environmental costs mainly through energy demand. Aeration, pumping, thermal oxidation, filtration, dewatering, and recovery systems can turn utility inflation into major Environment & Ecology cost escalation.
This is common where wastewater loads fluctuate, emissions streams vary, or treatment systems run below design efficiency. Energy waste then hides inside otherwise compliant operations.
Core judgment points
- Is treatment energy consumption tracked by process step?
- Do blowers, pumps, or fans run at fixed speed when loads vary?
- Are heat recovery or water reuse opportunities being lost?
- Does poor instrumentation cause overtreatment?
Here, Environment & Ecology cost can often be optimized. Better controls, load balancing, variable speed operation, and performance baselining usually deliver measurable savings without increasing environmental risk.
Scenario 3: Water-stressed or waste-heavy operations see unstable Environment & Ecology cost
In water-constrained regions or waste-heavy industrial processes, Environment & Ecology cost becomes more volatile. Intake pricing, discharge fees, hauling rates, and disposal capacity can all change faster than internal budgets.
This scenario often affects mining, chemicals, food processing, metals, and construction-linked operations. Costs rise when waste streams are mixed, poorly segregated, or difficult to classify for compliant disposal.
Core judgment points
- Is fresh water dependence too high for local supply conditions?
- Are disposal contractors concentrated in a limited regional market?
- Do waste streams require pre-treatment before transport?
- Can reuse, segregation, or by-product recovery reduce hauling volume?
For this scenario, Environment & Ecology cost is partly structural and partly operational. Site-specific material flow analysis often reveals avoidable waste handling costs hidden inside routine production decisions.
Scenario 4: ESG reporting maturity now changes Environment & Ecology cost
A growing share of Environment & Ecology cost now comes from data quality, traceability, and assurance requirements. Carbon, water, waste, and pollution metrics increasingly need source-level evidence.
This cost driver is strongest in export-oriented supply chains, infrastructure projects, and regulated public tenders. Weak data systems create rework, consultant dependence, and higher verification effort.
Core judgment points
- Are environmental metrics collected from primary instruments or spreadsheets?
- Can site data support external audits and customer reviews?
- Is the boundary between operational data and ESG data clearly defined?
- Do reporting gaps cause duplicated sampling or manual reconciliation?
In this case, Environment & Ecology cost falls when reporting architecture improves. Better integration between instrumentation, compliance systems, and asset records reduces repetitive effort and credibility risk.
How Environment & Ecology cost differs across common industrial scenarios
Practical ways to adapt Environment & Ecology cost by scenario
The most effective approach is to match investment type to cost pattern. Not every facility needs large capital upgrades. Some need better data, while others need stronger physical treatment capacity.
- Build a cost map linking permits, utilities, consumables, waste, maintenance, and reporting.
- Separate fixed compliance obligations from variable operating losses.
- Benchmark Environment & Ecology cost per unit of output, not only total spend.
- Install metering at major treatment stages to expose hidden energy or chemical intensity.
- Review supplier concentration for reagents, filters, sensors, and disposal services.
- Use pilot trials before full upgrades where process chemistry is uncertain.
- Integrate environmental records with maintenance and compliance workflows.
These actions improve visibility first. Once visibility is established, Environment & Ecology cost decisions become less reactive and more tied to site-specific risk and return.
Common misjudgments that distort Environment & Ecology cost planning
One common mistake is treating environmental spending as a compliance-only line item. That view misses downtime risk, permit delay exposure, reputational impact, and asset life reduction.
Another mistake is pursuing the lowest treatment or disposal price without checking performance reliability. Short-term savings often increase total Environment & Ecology cost through excursions, callbacks, and emergency interventions.
A third error is ignoring instrumentation quality. Weak sensors and poor calibration can trigger overtreatment, underreporting, or false alarms, each carrying significant direct and indirect cost.
It is also risky to separate ESG reporting from plant operations. When data systems are disconnected, the same environmental event generates operational loss, reporting burden, and audit friction.
Next-step actions for evaluating Environment & Ecology cost in 2026
A reliable 2026 review should start with scenario classification. Identify whether the dominant pressure comes from compliance, energy intensity, water and waste volatility, or ESG traceability demands.
Then build a practical decision file. Include current spend, unit cost trends, permit obligations, asset condition, supplier concentration, and measurable optimization opportunities.
For organizations comparing sites or planning upgrades, GIC-style technical evaluation adds value by connecting environmental engineering realities with sourcing discipline, standards awareness, and lifecycle cost logic.
The central takeaway is clear: Environment & Ecology cost in 2026 is shaped by scenario-specific pressures, not generic inflation alone. The strongest results come from targeting the right cost driver with the right level of technical response.
Technical Specifications
- How to Select Electronic Hotel Key Card Locks for Guest Rooms and Staff AreasAuthor :Safety Compliance Lead
- How to Select Lab Instruments for Reliable Chemical Analysis WorkflowsAuthor :Precision Metrology Expert
- How to Size a UPS for Server Rooms: Load, Runtime, and Redundancy FactorsAuthor :Grid Infrastructure Analyst
Expert Insights

Chief Security Architect
Dr. Thorne specializes in the intersection of structural engineering and digital resilience. He has advised three G7 governments on industrial infrastructure security.
Related Analysis
- Sep 17, 2026How to Select Electronic Hotel Key Card Locks for Guest Rooms and Staff AreasAuthor :Safety Compliance Lead
- Sep 16, 2026How to Select Lab Instruments for Reliable Chemical Analysis WorkflowsAuthor :Precision Metrology Expert
- Sep 15, 2026How to Size a UPS for Server Rooms: Load, Runtime, and Redundancy FactorsAuthor :Grid Infrastructure Analyst
Core Sector // 01
Security & Safety
- Environmental Technologies for Heavy Industry: Choosing Cleaner Production SolutionsAuthor :Environmental Engineering Director

- Selecting Air Compliance Equipment for Dust, Fumes, and VOC ControlAuthor :Environmental Engineering Director

- EU Rule Tightens EN 1822-2 for Industrial Air PurifiersAuthor :Environmental Engineering Director

- EU Eco-Design Rules Tighten for Air PurifiersAuthor :Environmental Engineering Director

- Low-Maintenance Dust and Fume Control Systems: Best Options for Welding ShopsAuthor :Environmental Engineering Director

- EPA Sets VOC Labeling Rule for Air PurifiersAuthor :Environmental Engineering Director

- Saudi SASO Rule Adds Real-Time Logging for Air SystemsAuthor :Environmental Engineering Director

- Saudi SASO Rules Tighten for Air PurifiersAuthor :Environmental Engineering Director